2nd Grade World's Deserts Graphs & Charts (Google Spreadsheet)
Incorporating Graphs/Charts (Math) with Biomes (Science)
My second grade class has been learning about biomes for the last month. I decided to have my students create a graph or chart that compares the number of deserts in each continent. I shared a Google document that stated two objectives:
The Google document also had a link to the Survival World website that listed all the deserts in each continent.
Steps in Creating Their Graphs or Charts:
- Open the Google document and visit the Survival World website to find out how many deserts there are in each continent
- Create a Google spreadsheet
- Create a table that lists the continents and the number of deserts in the continent
- Go to 'Insert' then 'Chart'
- Open Google Earth and search for 5 deserts
- Take a screenshot of one desert (command+shift+4 for the Mac) and insert it into a cell on the spreadsheet
- Open Google Earth and find
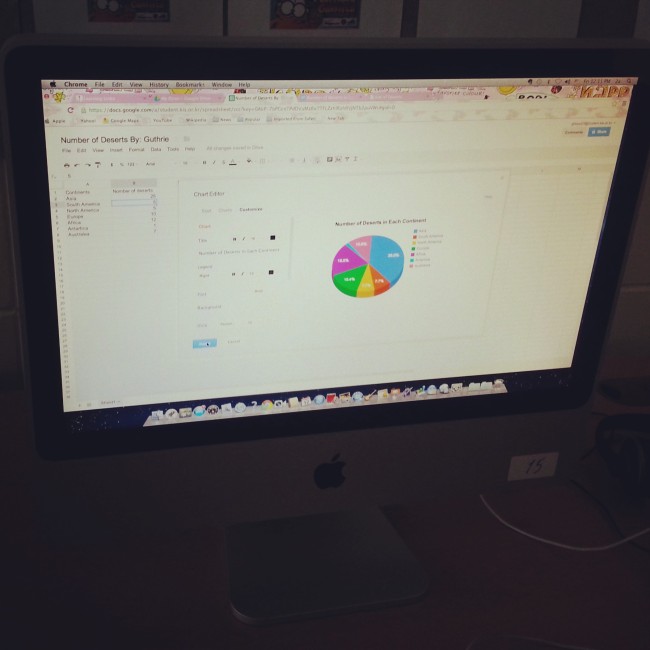
Example of Student Work
Here is what one of my students created.


Comments
Post a Comment